Interface
Main Interface
After starting ATOM, first enter the login interface. After entering the account and password, click Login to enter the ATOM main interface.
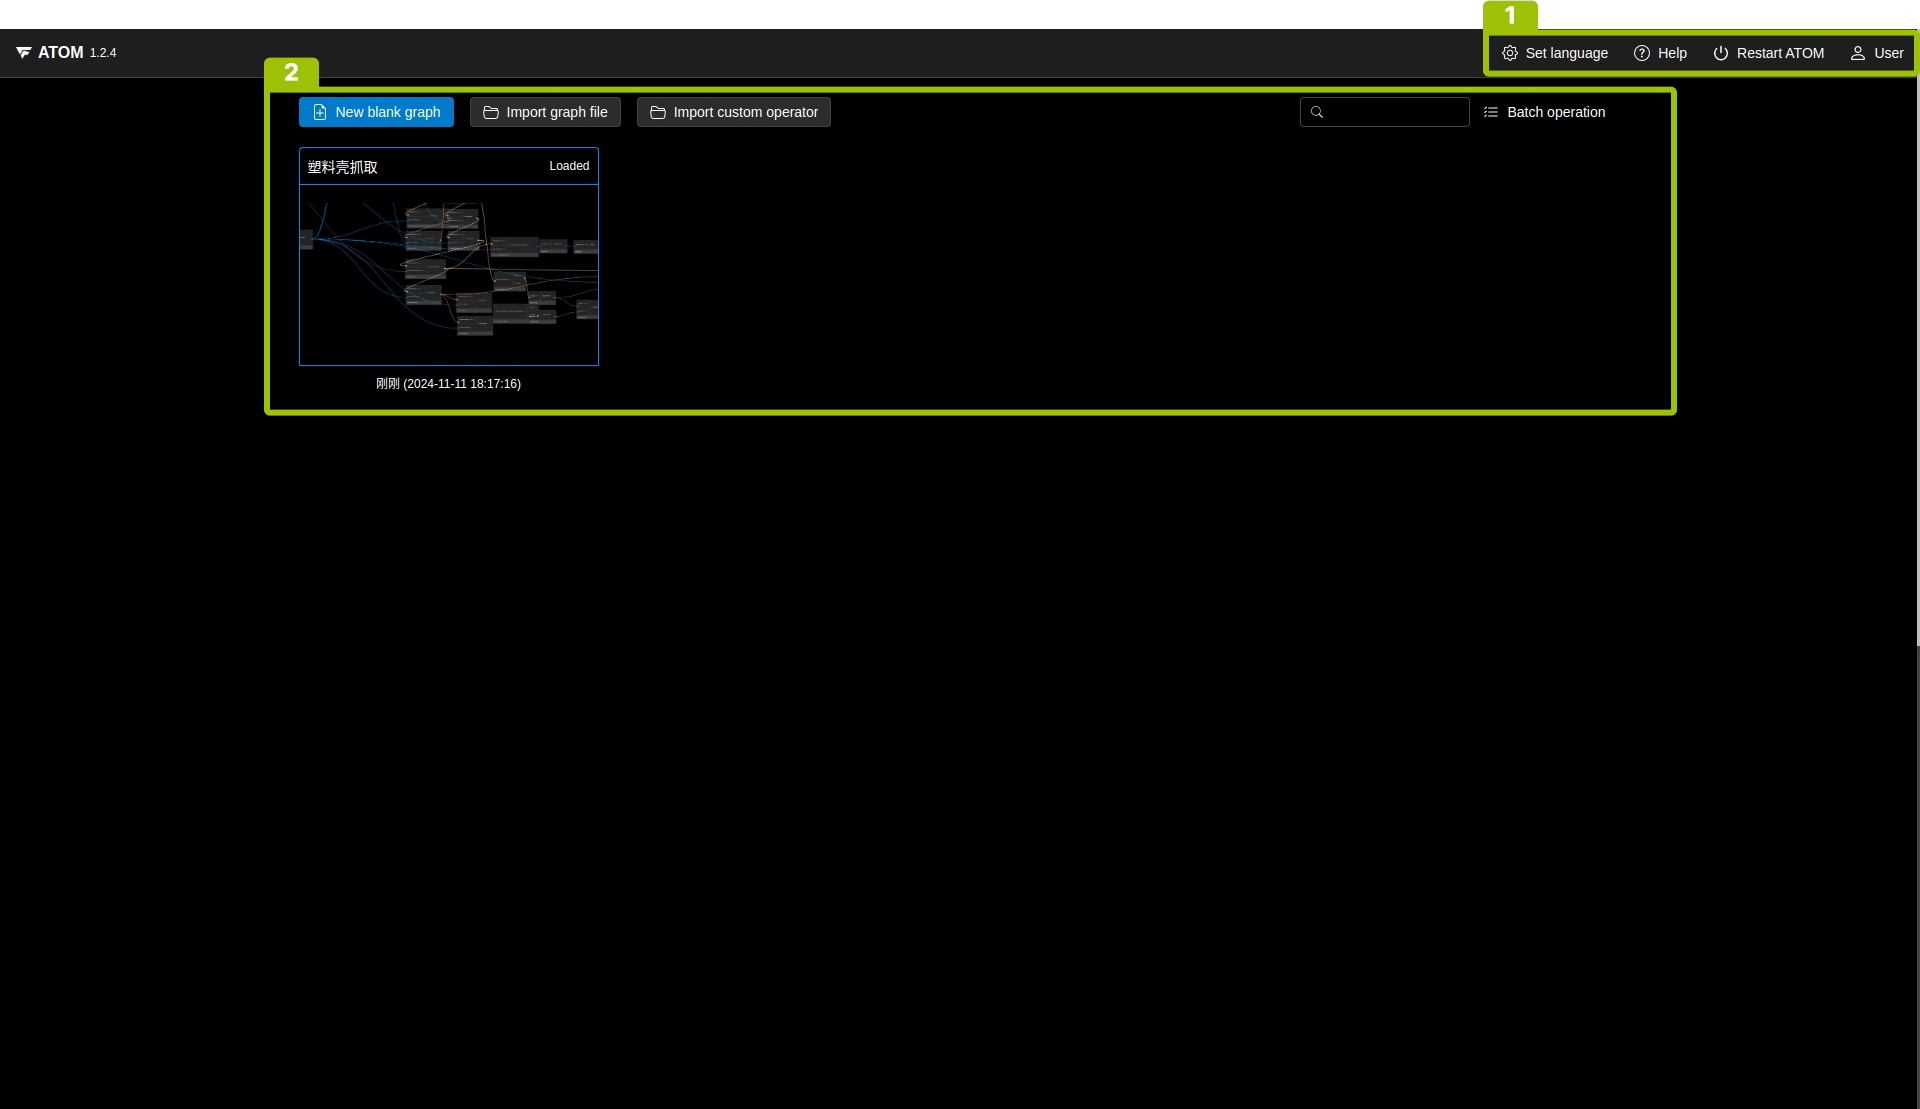
This interface consists of the following 2 parts:
Serial number |
Name |
Description |
|---|---|---|
① |
Menu Bar |
Set language, access help, restart ATOM, log out. |
② |
Graph management area |
Create a new blank graph, import graph files, import custom operators. Graph card right-click shortcut menu: The right-click shortcut menu of the graph card can delete the graph, export the graph, and release the graph. Search graph: Enter keywords in the search box to search. Batch export and delete: After clicking Batch operation, select graphs in batches and export or delete them. |
Graph Editing Interface
The interface after entering the algorithm graph is as shown below:
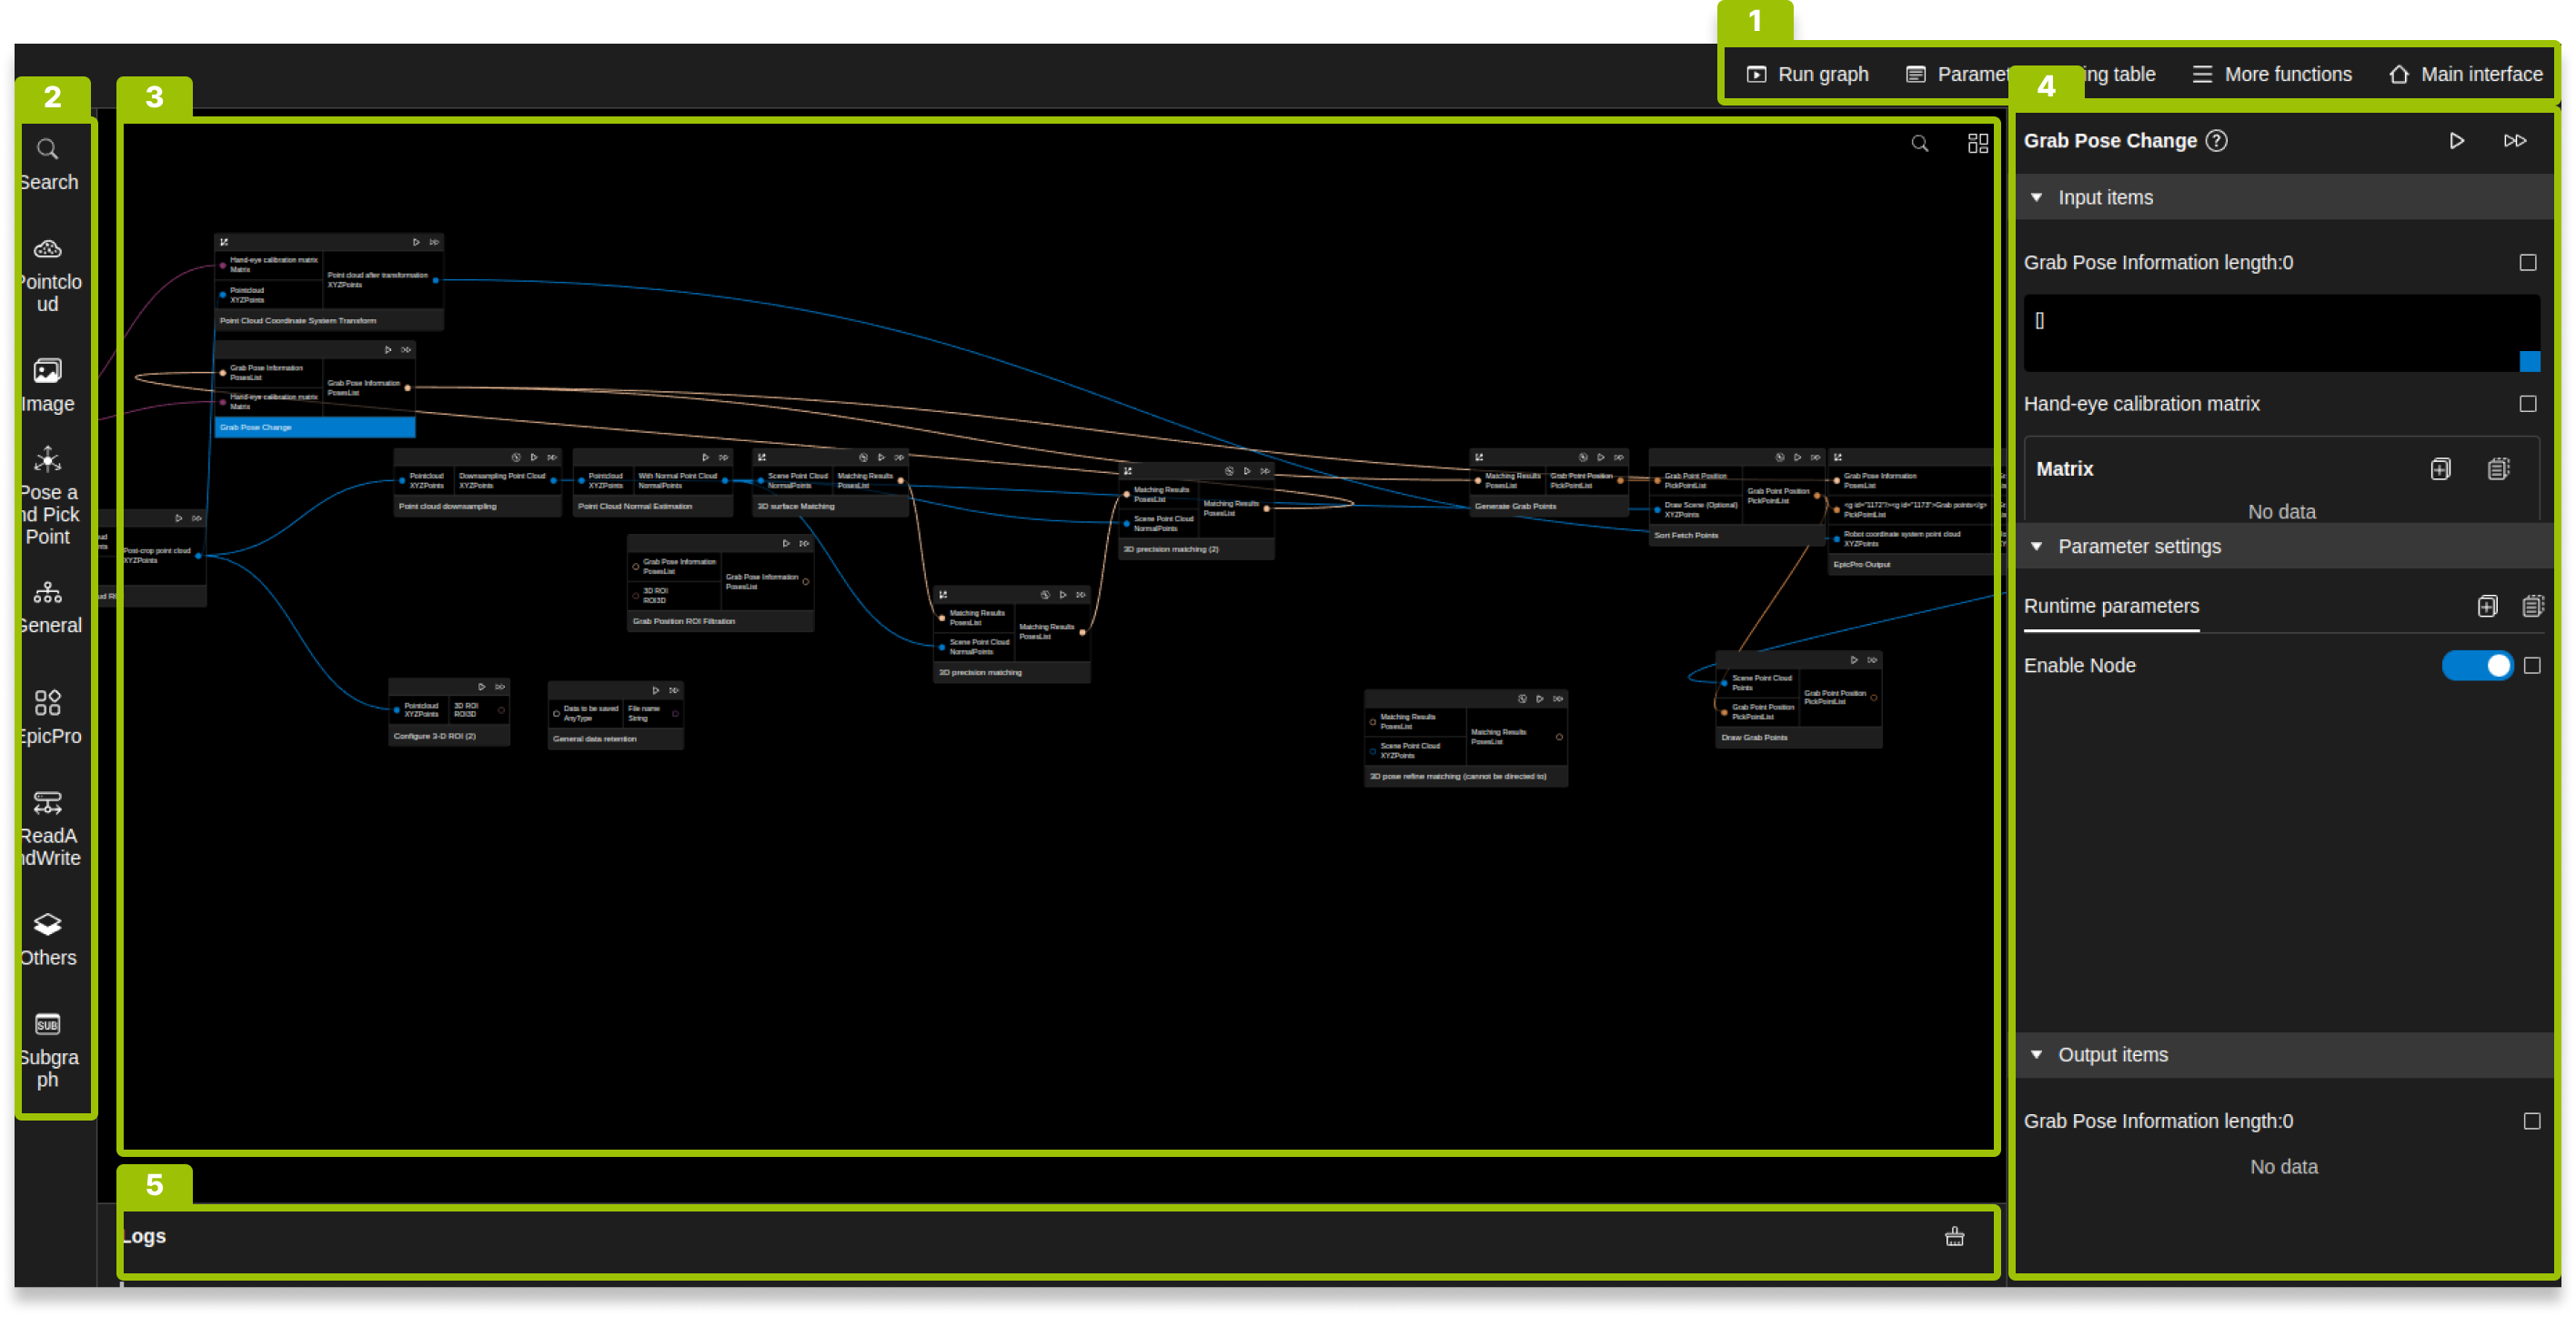
The interface consists of the following 4 parts:
Serial number |
Name |
Description |
|---|---|---|
① |
Menu Bar |
Run Graph, Set Parameter Mapping, Export Graph, Clear Data, Repeat Run, Return to Main Interface. |
② |
Operator library |
Expand the operator library by hovering the mouse, click Search in the operator library according to the operator category or enter keywords in the search box. |
③ |
Canvas |
Arrange and connect operators in the canvas. Click Click |
④ |
Operator Parameters |
Set the parameters of the corresponding operator in this area and view the operation results of the operator. |
⑤ |
Log |
Software operation log. |
Operator
Operator Composition
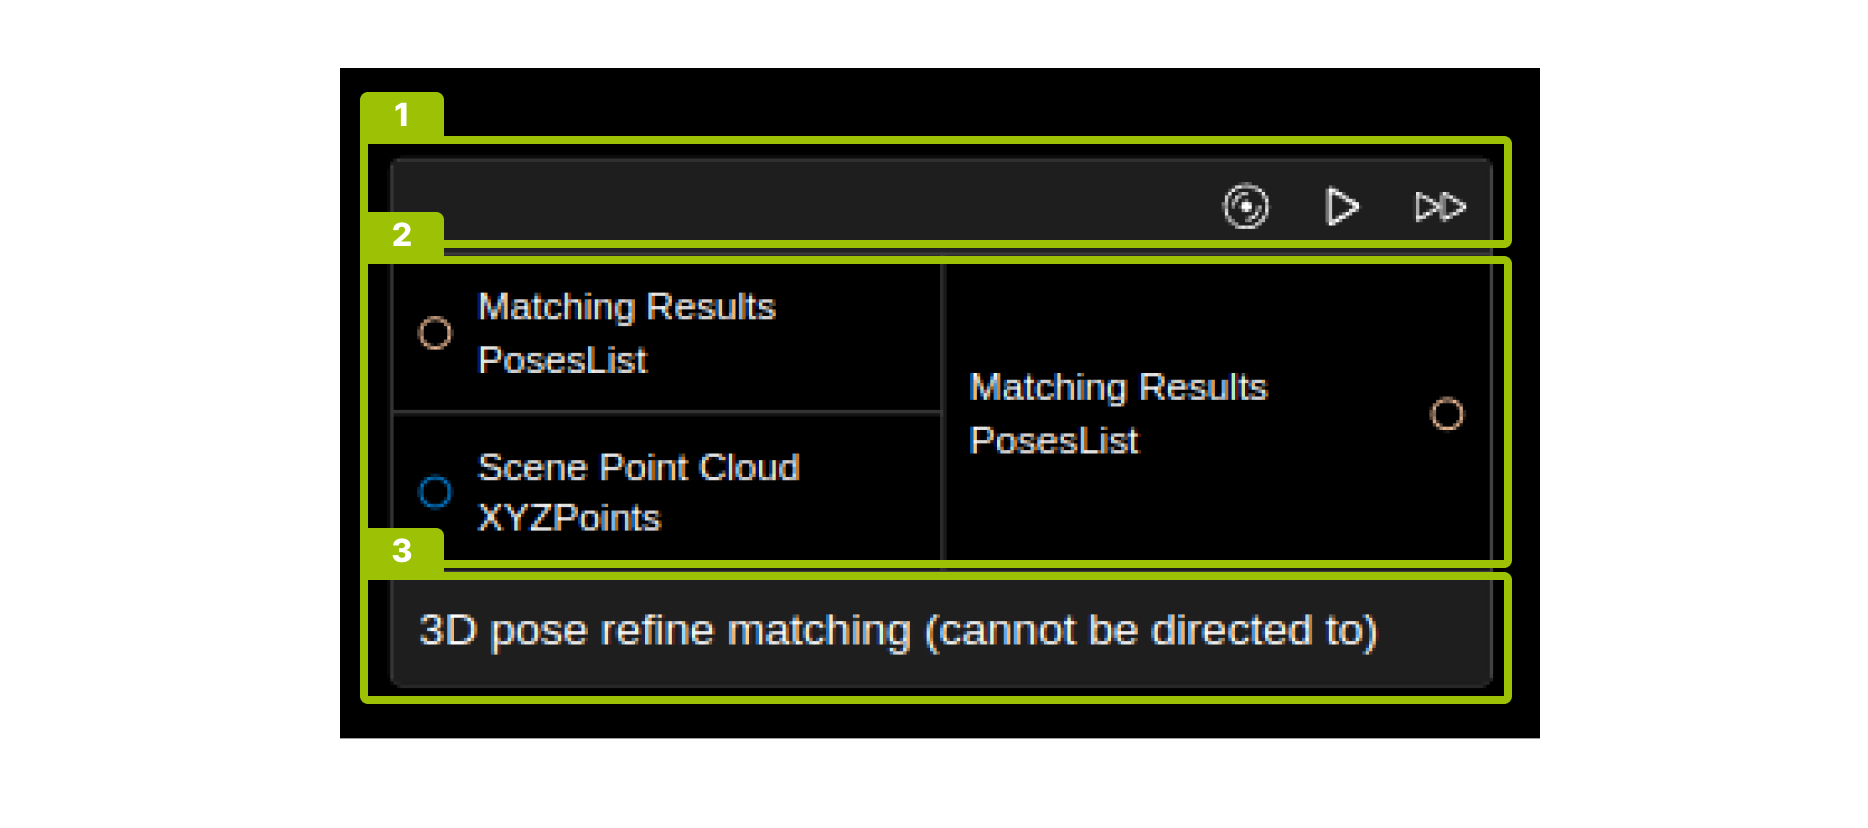
An operator consists of the following three parts:
Serial number |
Name |
Description |
|---|---|---|
① |
Function area |
|
② |
Node connection area |
The left side is the input node, and the right side is the output node. Each node consists of a node name and a node type. Left-click any output node to connect it to the input node of the same type of other operators. An output node can be connected to the input nodes of multiple operators, but an input node can only be connected to one input. |
③ |
Display area |
This area displays the operator name and operator notes (if added). |
Operator Right-click Shortcut Menu
-
Right-click an operator to pop up a shortcut menu, where you can annotate, copy, and delete operators; if you right-click an output node, an additional list of connectable operators is added.
-
Use the CTRL key combination to select multiple operators. Right-click to pop up a shortcut menu, where you can batch annotate, batch copy, batch delete, and cancel multiple selections.


Operator Parameters
Double-click an operator in the canvas to expand the operator parameter panel, which consists of operator operation, operator input, operator parameters, and operator output. Except for the operator operation area, each area can be expanded or collapsed, and the area display height can be adjusted by dragging.